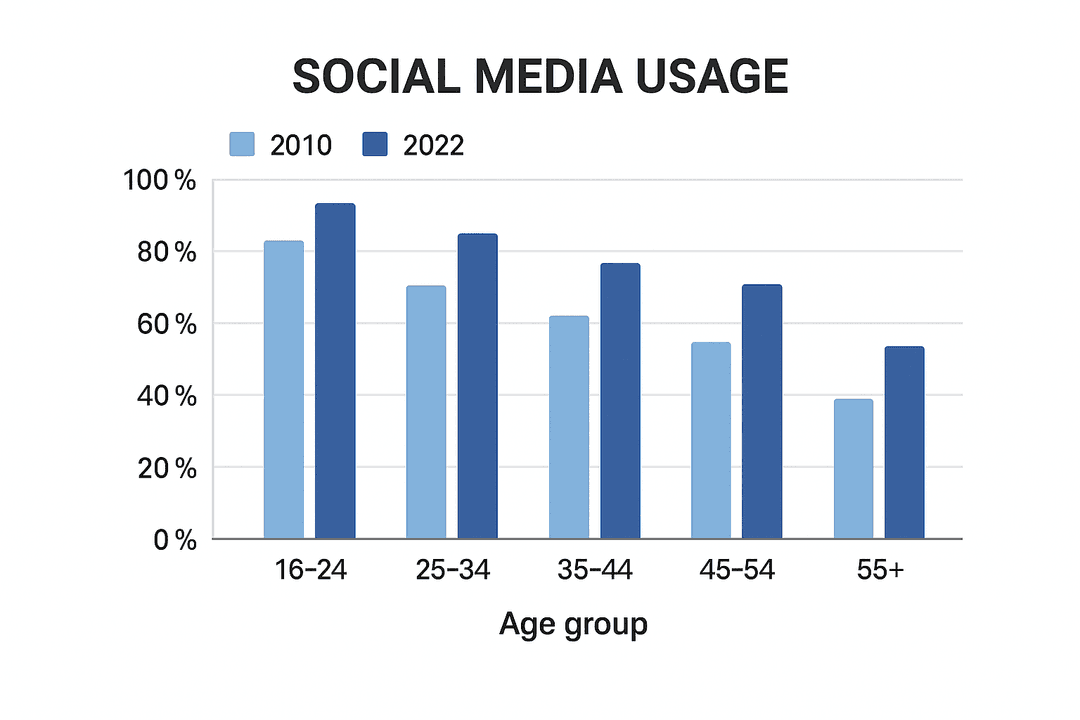
The bar chart below shows the percentage of people in different age groups who used social media platforms in a European country in 2010 and 2022.
Summarise the information by selecting and reporting the main features, and make comparisons where relevant.
Write to See your Score
Words: 0
No submissions yet